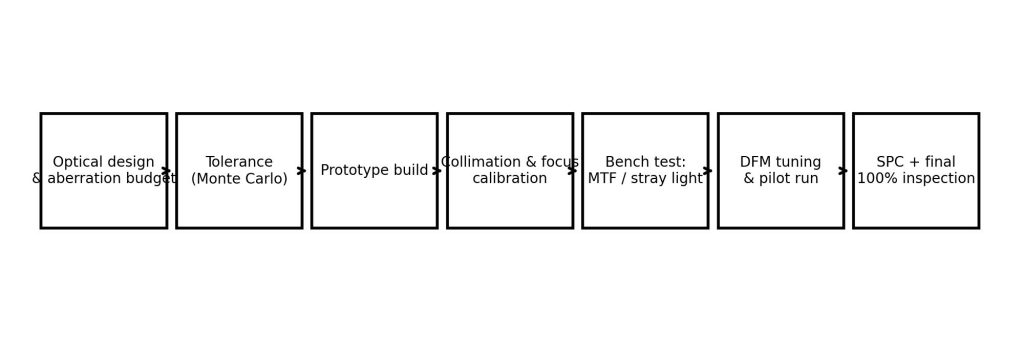
From Aberration Budget to Assembly Yield in Binocular System Engineering
A “True 8×” Is a System-Level Closed Loop
In the industry, writing “8×” on a spec sheet is not difficult. What’s difficult is making users consistently feel, in real-world use: clear image, good transparency, usable edges, low eye fatigue, and batch-to-batch consistency.
If you want to turn “true 8×” into a manageable engineering goal, we suggest organizing R&D and mass production around three main lines:
1) Specification side: Turn magnification, field of view, exit pupil, and eye relief from nominal numbers into clearly defined, re-measurable standards with specific acceptance criteria.
2) Design side: Use an aberration budget to clearly define the priority between center performance, edge performance, and backlight contrast.
3) Manufacturing side: Include assembly window, rework rate, and process capability in the cost curve—rather than looking at BOM alone.
- When users feel that one product is “much worse,” it usually comes from: edge image quality (astigmatism / coma / field curvature) + micro-contrast (phase correction / coatings / stray light control) + image merging stability (assembly precision / structural stability).
- In the lower price range, products rarely fail at center resolution. What usually goes wrong is usable field of view, batch consistency, and long-term viewing comfort.
- The key to building a “true 8×” is not stacking specifications, but writing the “usable experience” into the budget sheet and the QC plan.
1) Clarify “8×”: Strict Definitions and Measurable Methods
To be precise, the magnification of a binocular is angular magnification:
M = tan(θ′) / tan(θ)
where θ is the angle subtended by the target when viewed with the naked eye, and θ′ is the angle when viewed through the binocular.
Why do users feel that an “8×” looks like “7×” or “9×”? Common causes include:
• Inconsistent specification of aperture: Some manufacturers measure magnification at a fixed focus position, while others measure at infinity.
• Focus breathing: Magnification changes as the focal length shifts, especially noticeable at close distances.
• Diopter and eye position errors: Subjective perception is influenced by the eye box and distortions.
• Batch differences: Tolerances in optical spacing, prism housing position, and lens eccentricity accumulate.
Thus, “true 8×” does not mean accuracy to two decimal places, but rather: under agreed measurement conditions, the magnification error is controllable and batch-to-batch stability is ensured.
Three Measurable Magnification Methods for Mass Production (Suggested to Include in SOP)
- Infinity/Collimation Method: Use a collimator or equivalent optical path to project the target image at infinity and measure the angular magnification. The advantage is strong repeatability, making it suitable for batch consistency control.
- Long-Distance Comparison Method: At a sufficiently long distance (as close as possible to infinity), use a calibrated target for comparative measurements. The advantage is that the equipment threshold is low; the disadvantage is that it is sensitive to distance, thermal disturbances, and measurement consistency.
- Equivalent Focal Length Method: Estimate magnification based on the objective lens focal length and the eyepiece focal length (M ≈ f_obj / f_eye), used for quick verification during the design phase; for mass production, it is still recommended to use the collimation or comparison method.
Practical Suggestion: Clearly define the “measurement conditions” (infinity/distance, temperature, eyepiece position, whether focus is adjusted to a specific calibrated position) in the RFQ and acceptance standards. Otherwise, “magnification disputes” will turn into supply chain finger-pointing.
2) Aberration Budget: Why Low-Cost 8× Models Often Have “Sharp Centers but Messy Edges”
An 8× platform places high demands on the “scanning experience”: birdwatching requires quickly locating targets, travel use involves viewing while walking, and concerts require following movement on stage.
When you pursue a wider field of view, aberrations increase rapidly. Typical symptoms include:
• Reduced edge resolution: caused by the combined effects of astigmatism, coma, and field curvature;
• Darkened edges: vignetting due to limited effective aperture and insufficient stray light control;
• Scanning dizziness: distortion and angular magnification distortion (AMD) are not properly controlled.
The so-called “aberration budget” means deciding in advance, under a fixed cost framework, which user experience indicators must be protected and which can accept compromise.
Break “Clarity” into Four Types of Aberrations: Solve the Right Problem Instead of Just Adding More Glass
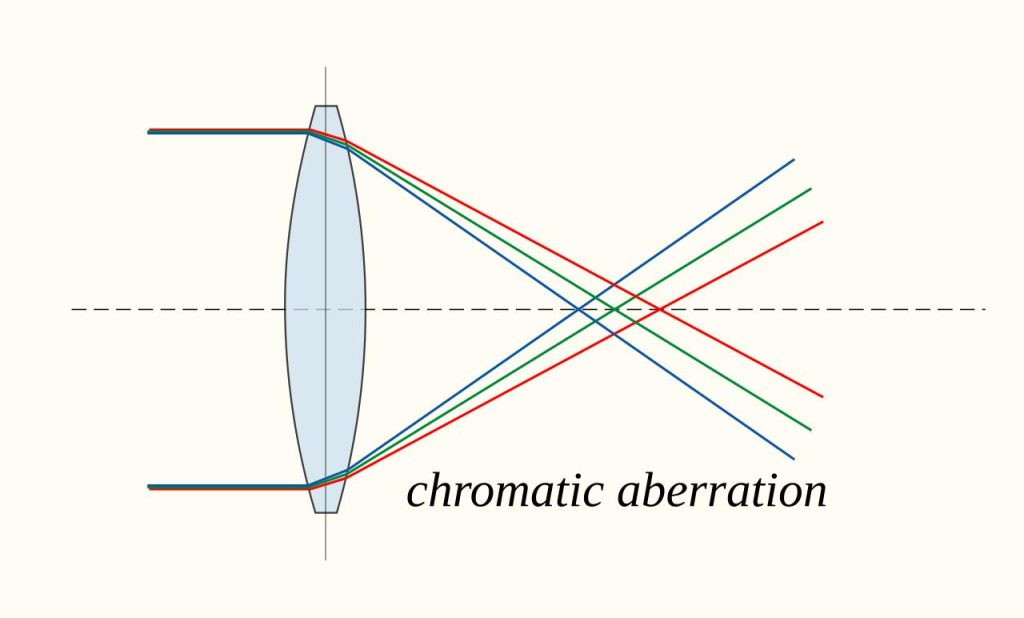
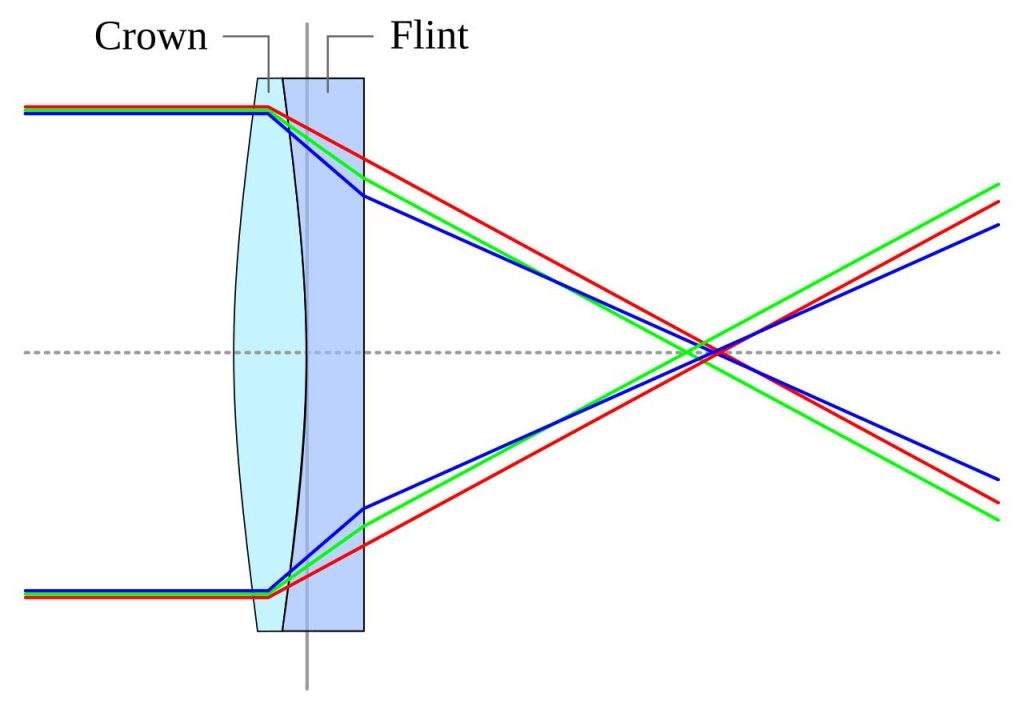
- Chromatic Aberration: Purple or green fringing appears along high-contrast edges and is often directly perceived by users as a “cheap” look.
- Spherical Aberration: Reduces center resolution and weakens the transition from in-focus to out-of-focus areas, often described as “soft” or “lacking punch.”
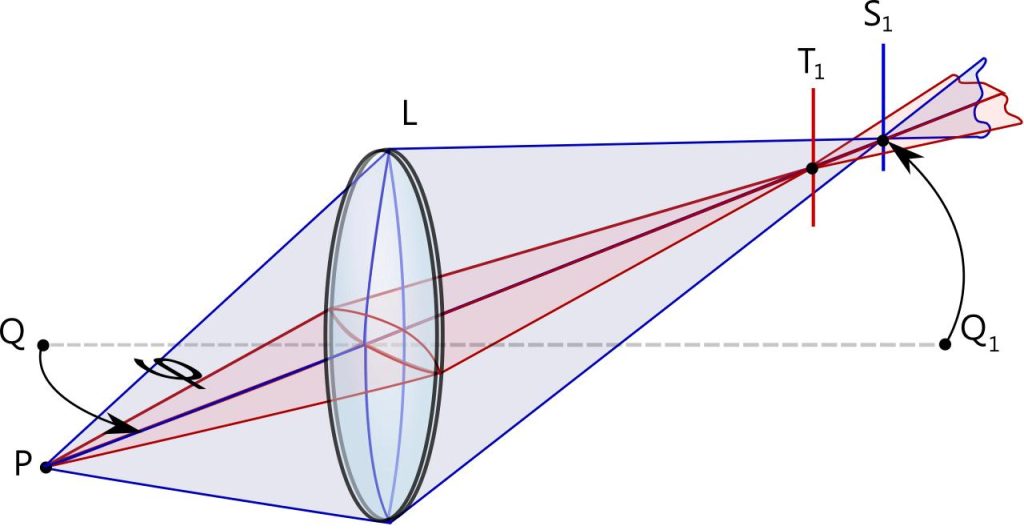
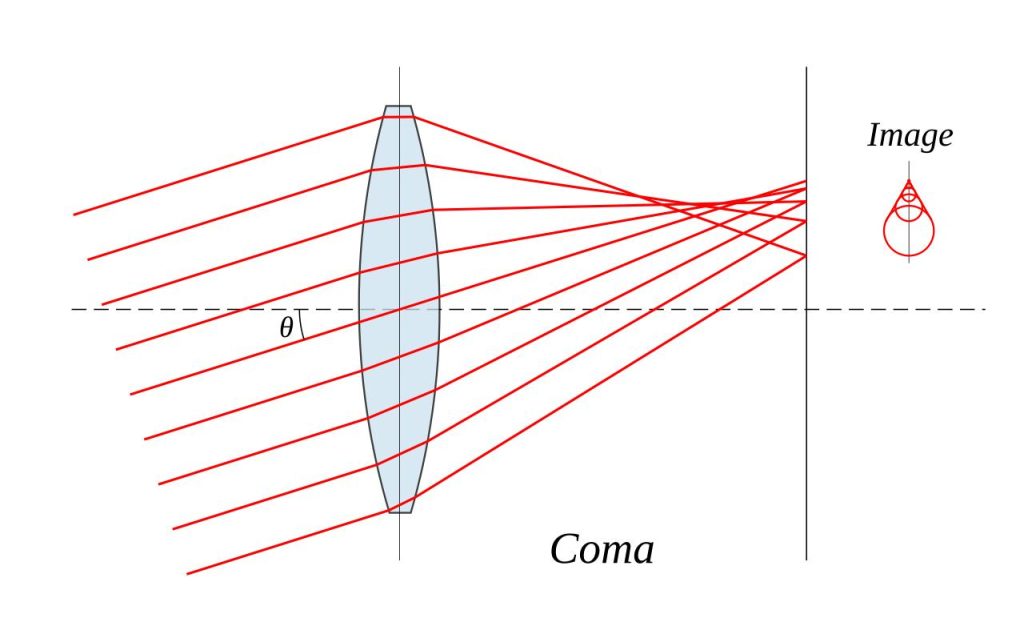
- Astigmatism / Coma: Causes streaking or smearing at the edges, especially noticeable during scanning.
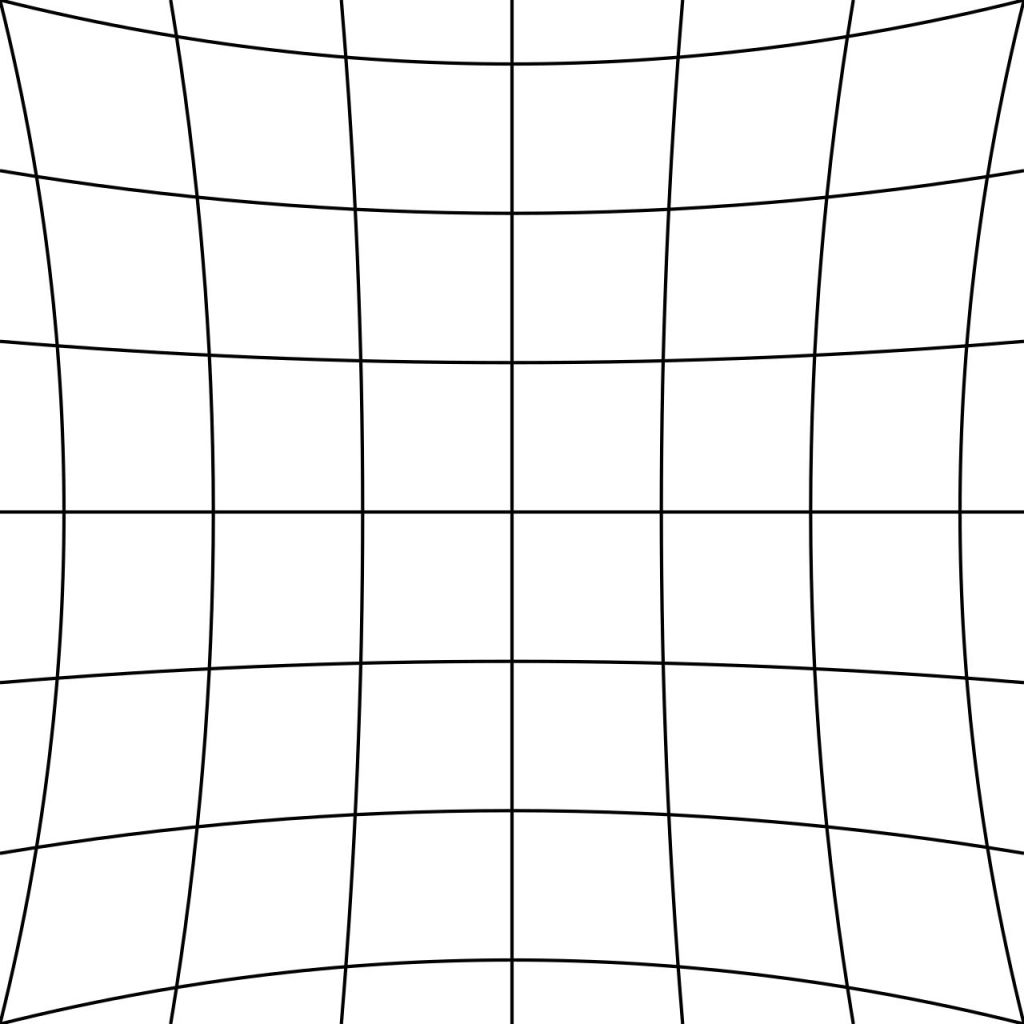
- Field Curvature: Makes it difficult to keep both center and edge in focus at the same time; users who wear glasses or view for long periods are more sensitive to this.
A Practical “8× Aberration Budget Table” (Can Be Directly Used for Review and Prototyping)
The table below shows a commonly used format: set targets by layers such as “center / mid-field / edge” and “front light / backlight,” and link them to measurable acceptance items. The numerical thresholds should be defined according to your product positioning and test conditions.
| Zone / Scenario | User Perception | Main Risk | Design Lever | Mass Production Acceptance Recommendation |
| Center (Daytime) | “Sharp at first glance” | Spherical aberration / decentering causing softness | Center aberration correction, lens decentering control | Center resolution / MTF sampling + batch comparison |
| Mid-field (Scanning) | “Smooth scanning, no dizziness” | Improper AMD / distortion | Distortion allocation, AMD control | Subjective scanning test + line target |
| Edge (Target locating) | “Edges still usable” | Astigmatism / coma / field curvature | Eyepiece design, field flattening and light margin | Edge resolution / illumination curve |
| Backlight / Stage lighting | “Not washed out, minimal ghosting” | Stray light / coating variation | Internal blackening and baffling, AR coating consistency | Backlight grading evaluation + comparison samples |
| With glasses | “No blackout, no eye pressure” | Insufficient eye relief / narrow eye box | Eyepiece eye relief design, eyecup structure | Eye relief / exit pupil position verification + long-duration viewing test |
3) Field of View and Handling: Why the Same “8×” Can Feel Completely Different When Scanning
Consumers often sum it up in one sentence: some binoculars feel “comfortable to scan with,” while others “make you feel nauseous.”
Behind this difference is usually not magnification, but the design trade-off between distortion and angular magnification distortion (AMD).
• Distortion mainly affects whether straight lines appear curved.
• AMD mainly affects the globe effect during scanning.
Many low-cost products try to make the spec sheet look better by claiming a larger FOV. However, without enough budget to properly control AMD and edge aberrations, the final user experience can actually become worse.
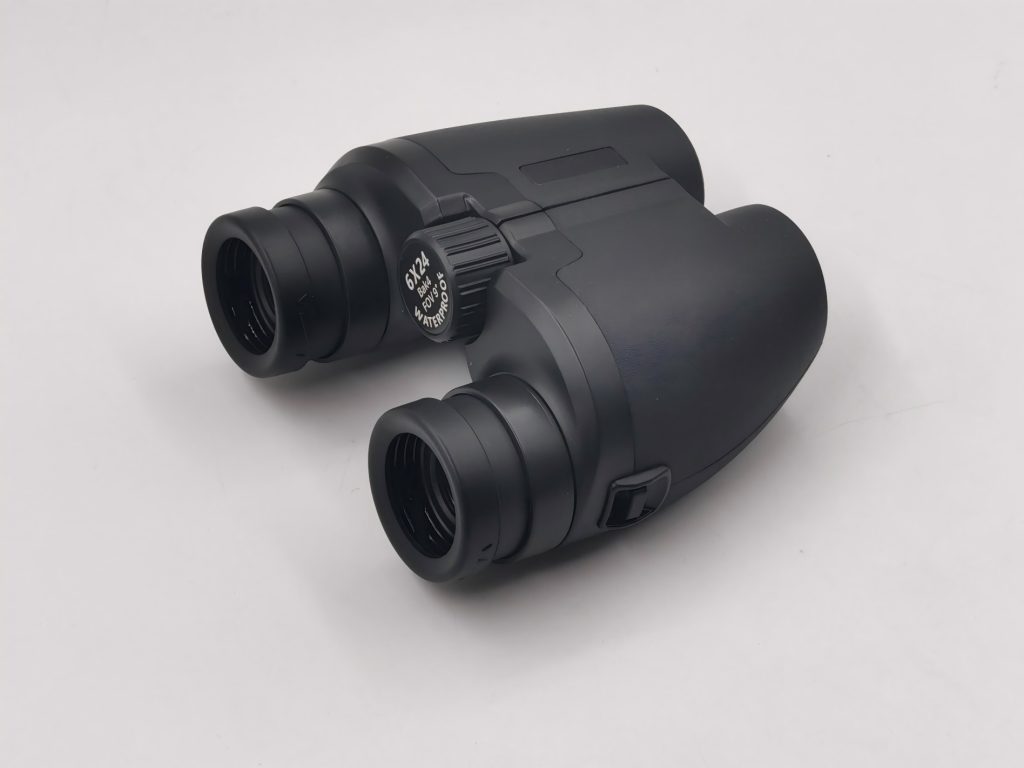
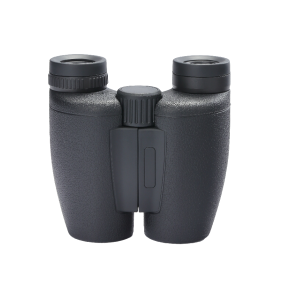
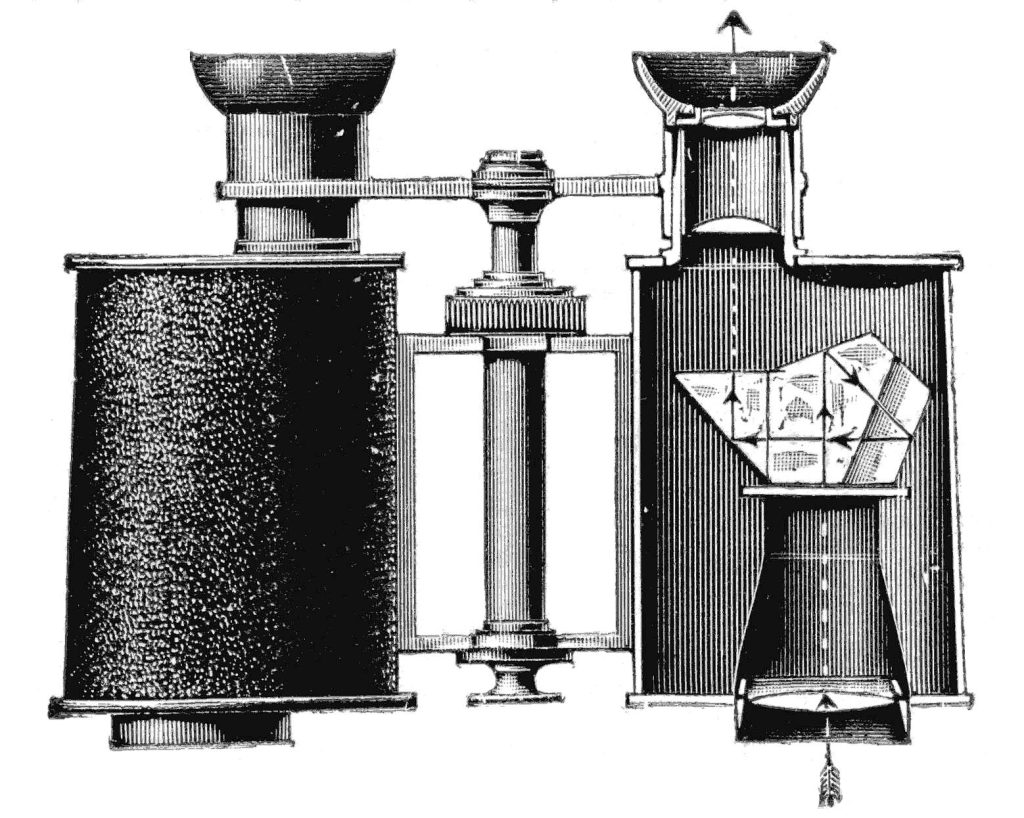
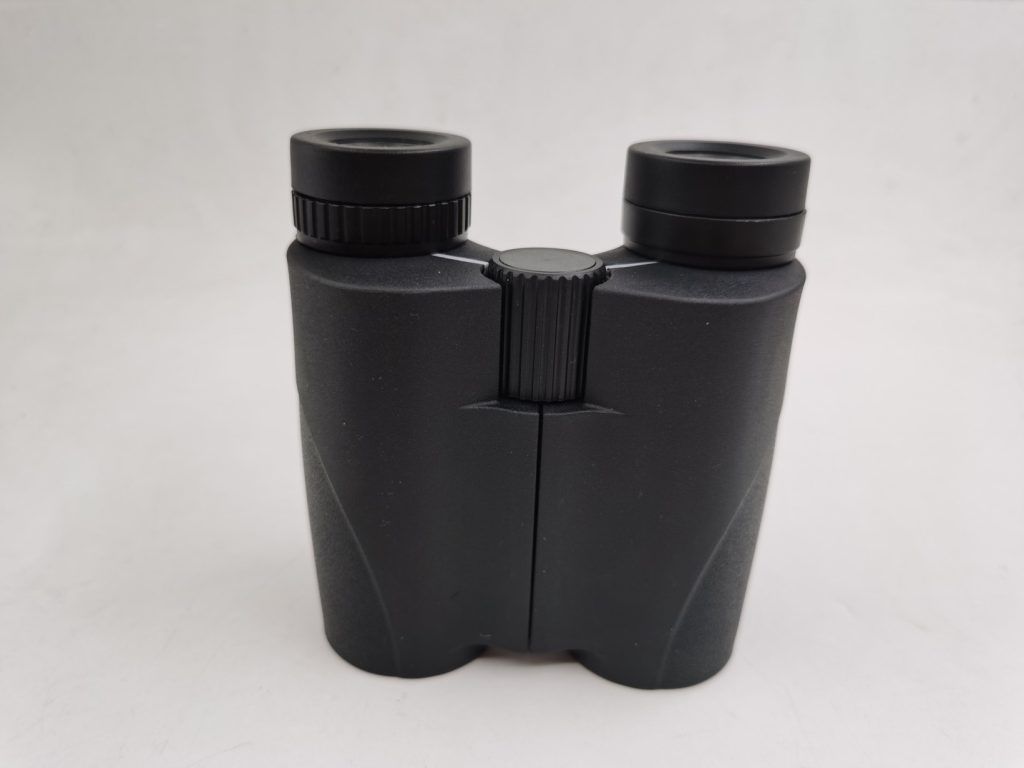
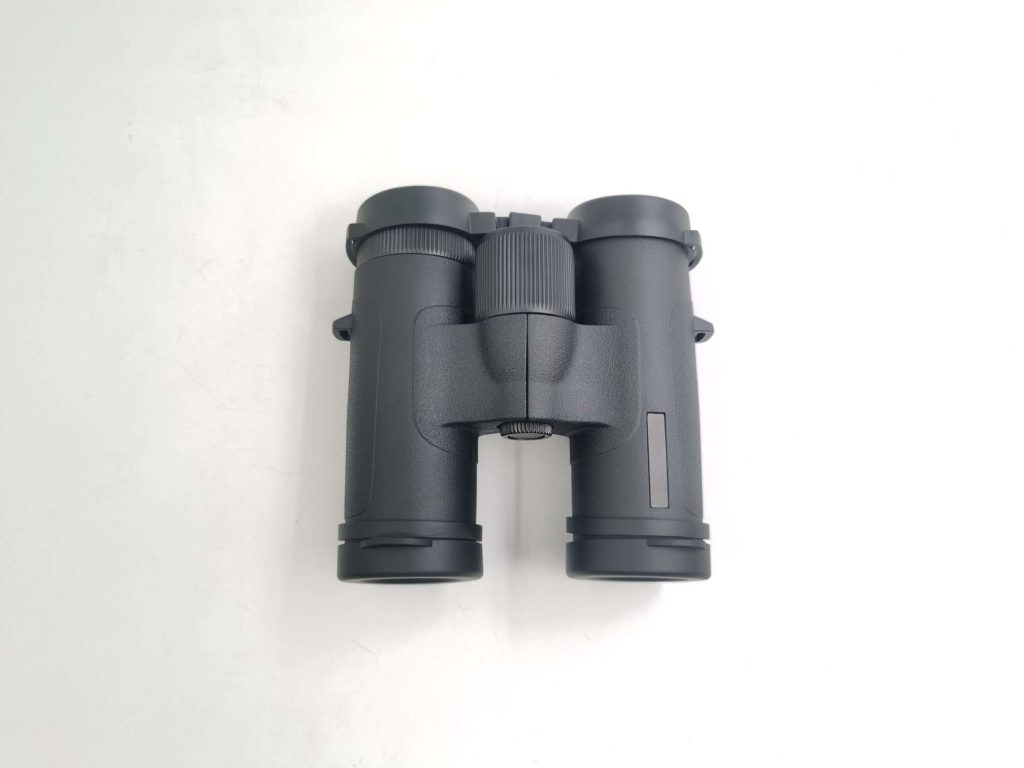
4) Prism Structure and Contrast: Roof vs. Porro Is Not Just About Appearance
In the $50–$300 range, the experience difference between Roof and Porro designs often first shows up in contrast and brightness consistency.
The reason is that different prism structures rely on different reflection paths, phase behavior, and coating systems, which in turn affect:
• The upper limit of light transmission;
• Micro-contrast (whether the image looks washed out or not);
• Batch consistency (coating window and assembly tolerance window).
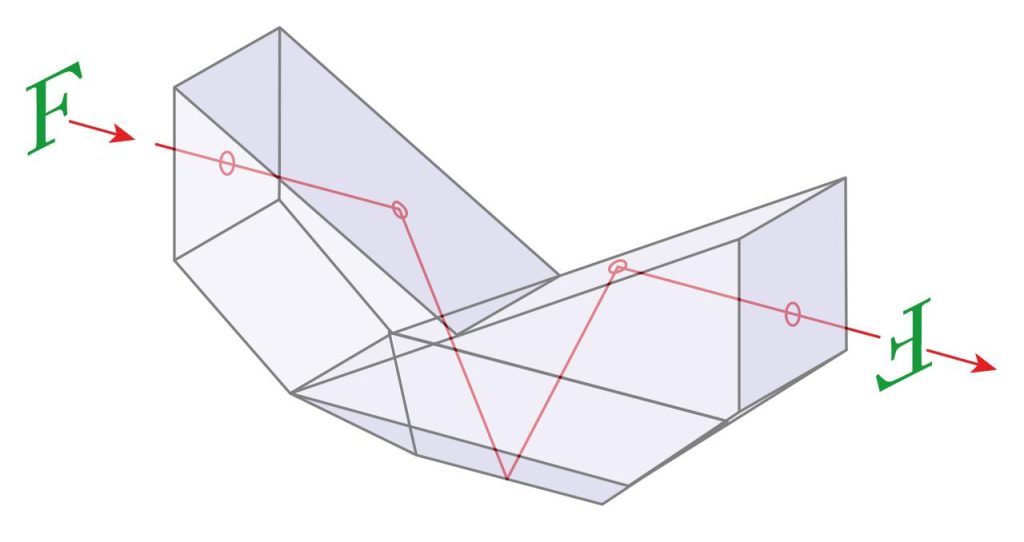
Two Typical Roof Prism Paths: Schmidt-Pechan and Abbe-König
For mid- to high-end Roof designs, Abbe-König is often used to pursue higher system efficiency and better low-light performance;
for compact Roof designs, Schmidt-Pechan is more common.
However, regardless of the chosen path, Roof systems rely more heavily on phase correction and the coating consistency of key reflective surfaces to maintain micro-contrast.
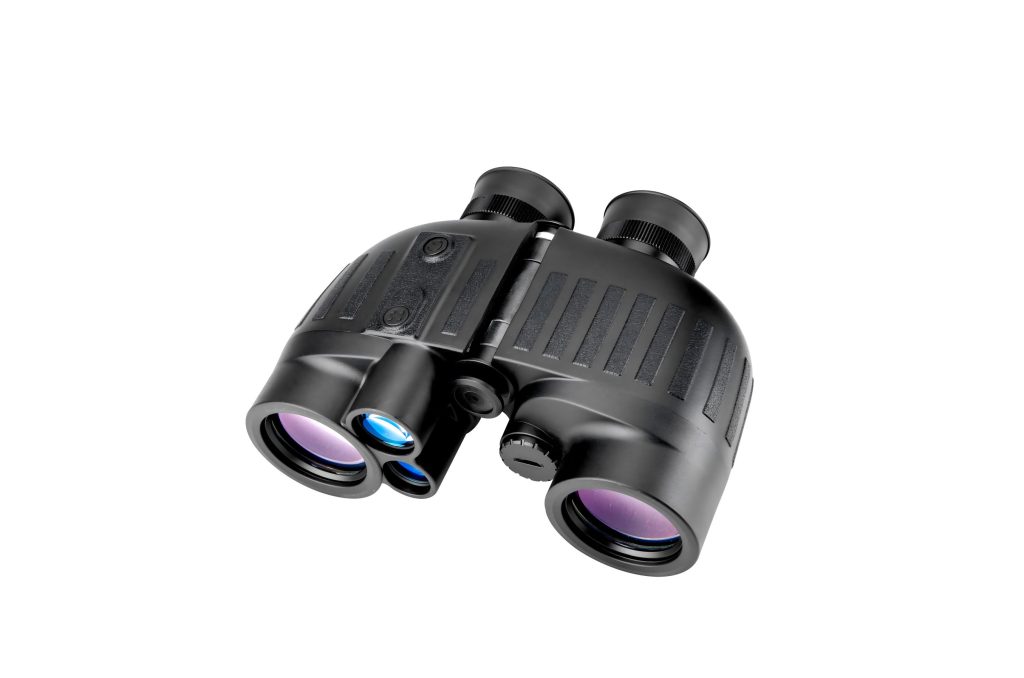
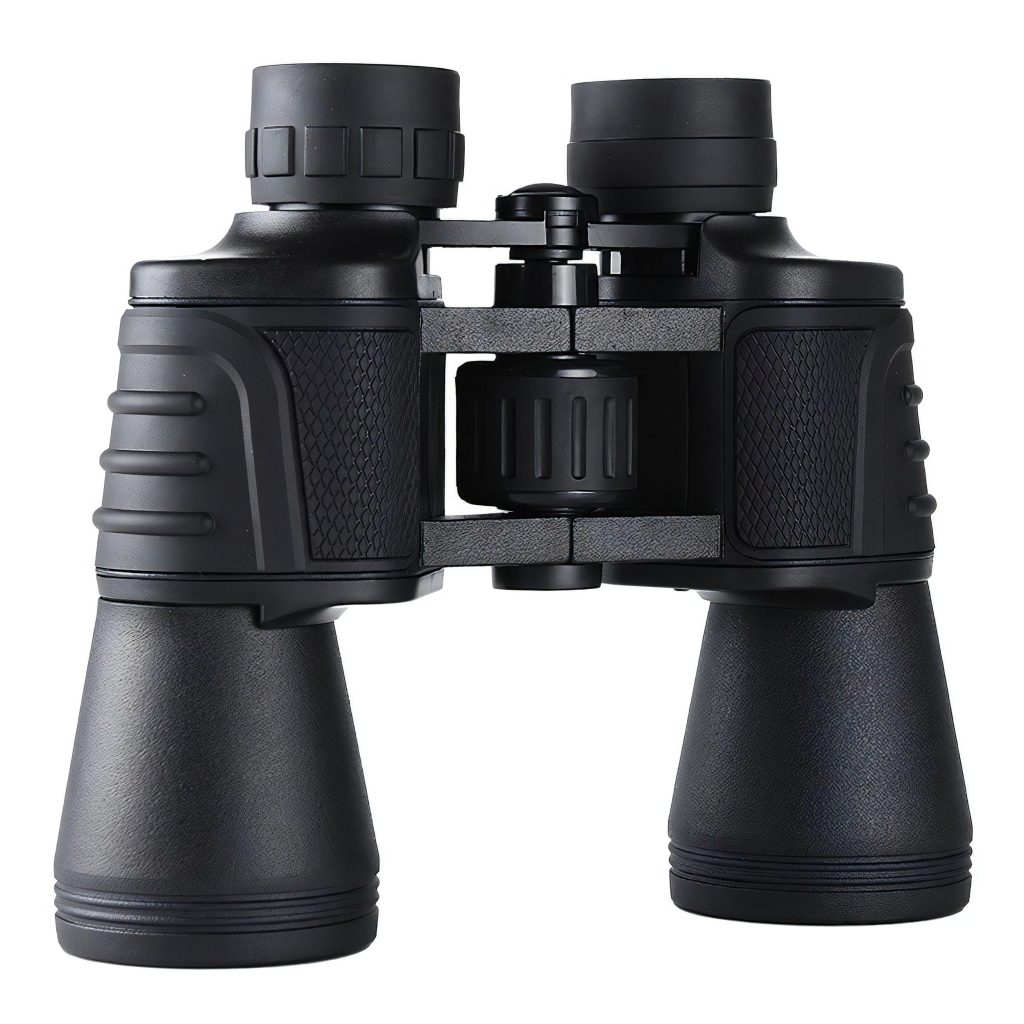
Where Does Porro’s “Value-for-Money Advantage” Come From?
The advantages of the Porro structure usually lie in two areas:
• Reflection efficiency: Many reflective surfaces rely on total internal reflection (TIR), reducing dependence on high-reflectivity coatings;
• Assembly tolerance: Larger geometric margins make it easier to achieve stable and consistent performance in the lower price range.
This is also why, in the $50–$100 segment, Porro designs are more likely to deliver an image that feels “bright at first glance” with solid contrast.
5) Assembly Yield: Why “Good Designs” Often Fail in Mass Production
Eye strain, dizziness, and double images in binoculars are essentially problems of optical axis alignment and image plane consistency between the two channels.
In mass production, the hardest part is not tuning one prototype perfectly, but ensuring that 10,000 units all fall within the same comfort window.
Therefore, we suggest breaking assembly and adjustment into three parts:
• Structural stability: Repeatable positioning of the hinge axis, prism housing, and lens mounts;
• Adjustability: Whether the design of eccentric rings, shims, and prism micro-adjustments provides sufficient and reasonable degrees of freedom;
• Acceptance criteria: How image alignment error is defined (horizontal / vertical / rotational), and what the sampling ratio and rework strategy are.
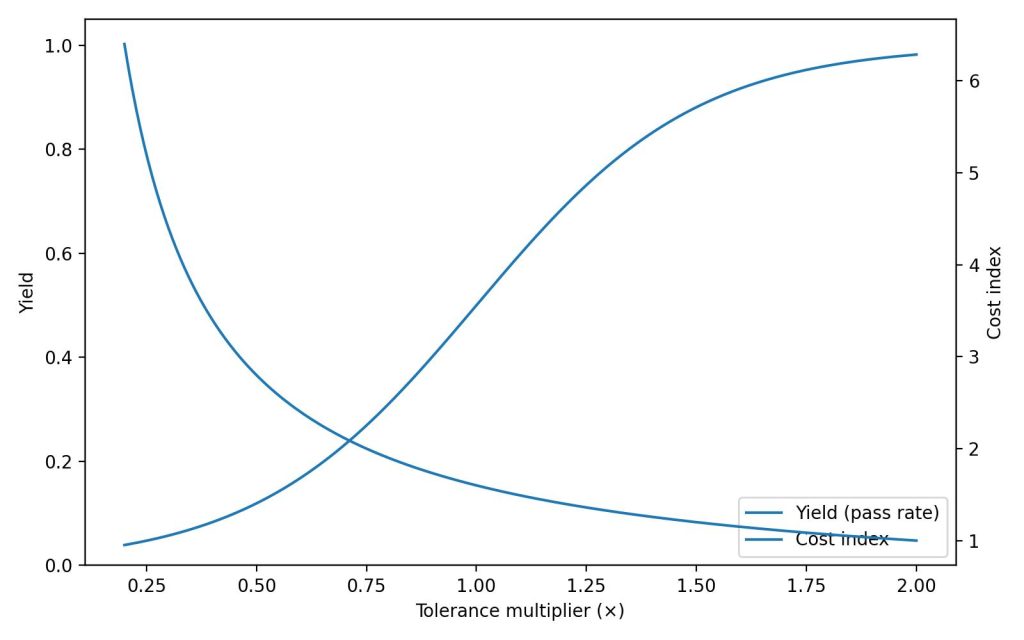
“Tolerance–Yield–Cost” Is a Curve, Not a Single Point
Many teams break down cost by looking only at the BOM. However, what often truly separates Roof and Porro designs—or different platforms—on price is the yield curve. When the assembly window becomes narrower and rework increases, each rework cycle amplifies unit cost while also slowing down production capacity.
From an engineering perspective, this can be understood through the concept of process capability: if a key error approximately follows a normal distribution, the narrower the specification window, the more sensitive the yield becomes.
Ways to improve yield include either “tightening tolerances (reducing σ)” or “widening the window (optimizing structure and adjustability).”
6) Making “True 8×” Verifiable: Targets, Instruments, and Sampling Strategy
To turn subjective impressions into manageable metrics, it is recommended to build a “layered verification system” for the $50–$300 platform:
• R&D validation: Use test targets + backlight scenarios + temperature cycling to confirm whether the performance budget holds.
• Mass production sampling: Convert key indicators into executable workstation tests.
• Shipment consistency: Use golden samples and batch-to-batch comparisons to control distribution.
Resolution Targets: From “Looks Sharp” to “Measurable”
The Siemens Star is one of the commonly used targets for evaluating resolution and focus sensitivity. Its advantage is that focus deviation is very intuitive, making it suitable for quickly comparing clarity and astigmatism trends across different areas.
In binocular applications, it can be used for:
• Comparing center vs. edge sharpness;
• Comparing consistency between left and right channels;
• Observing edge performance changes during scanning.

Collimation / Calibration: Making “Magnification, Focus, and Edge” Measurements Consistent
In a mass production environment, placing the target into a collimation or calibration system (or an equivalent optical path) can significantly improve test consistency:
• Reduce distance errors and environmental influence;
• Make readings from different shifts or operators more consistent;
• Facilitate the creation of batch trend charts.
The photos below show a typical approach of placing a Siemens Star into a collimation system (commonly used for camera autofocus calibration; the principle is similar).
7) Recommendations for an 8× Platform in the $50–$300 Range: Spend Where Reputation Turns
If your main battlefield is the $50–$100 and $100–$300 segments, we suggest planning the 8× lineup through “platform strategy + tiered metrics”:
• Entry-level segment: First secure usable field of view, brightness, and consistency (avoid edge vignetting and wide batch variation).
• Mid-range segment: On the basis of consistency, then pursue a more compact structure, longer eye relief, stronger waterproofing, and better backlight contrast.
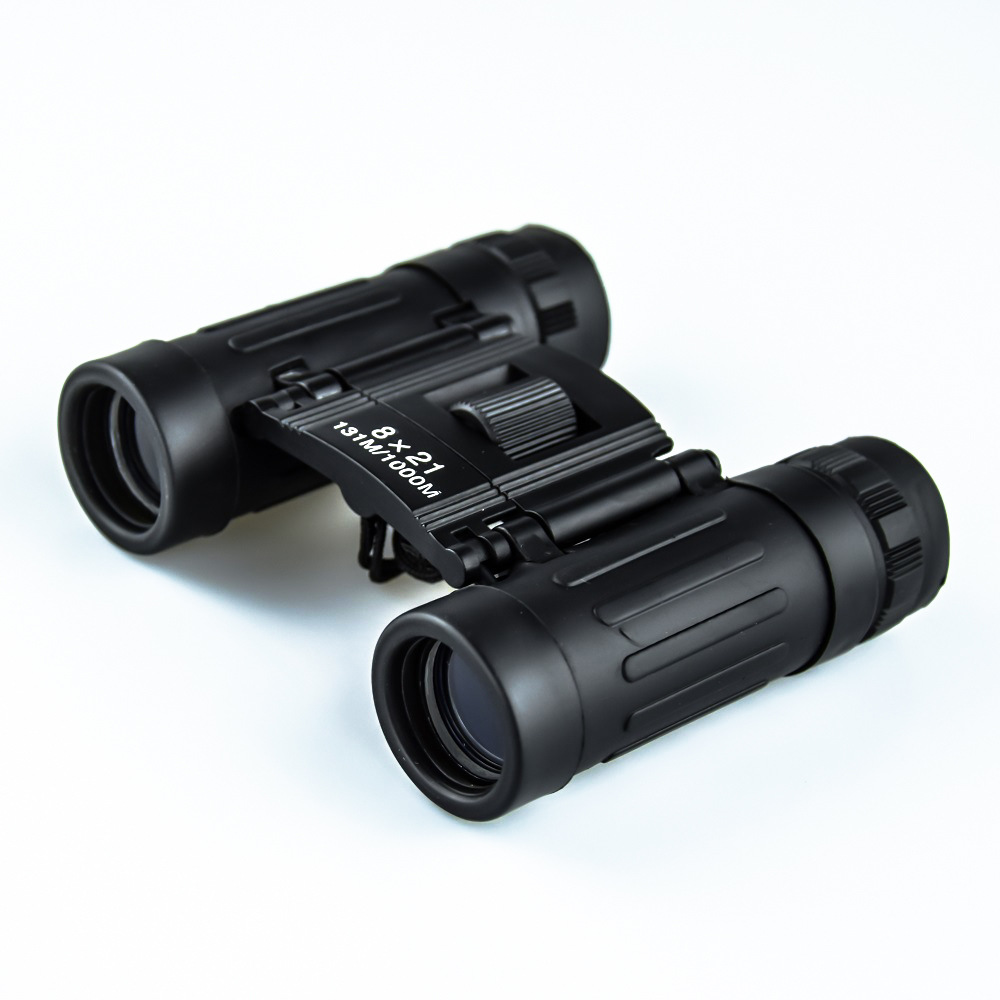
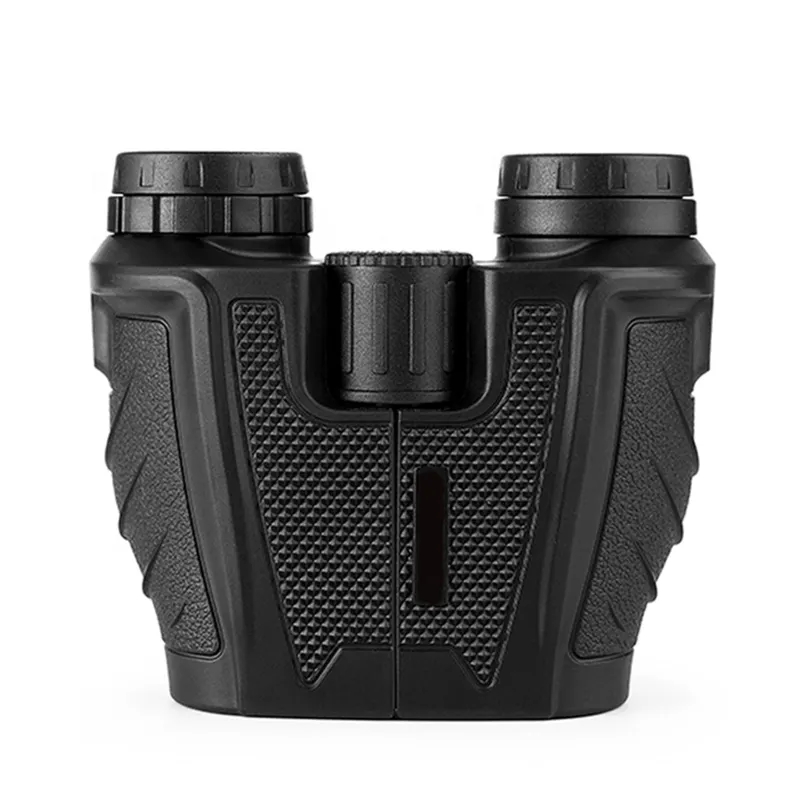
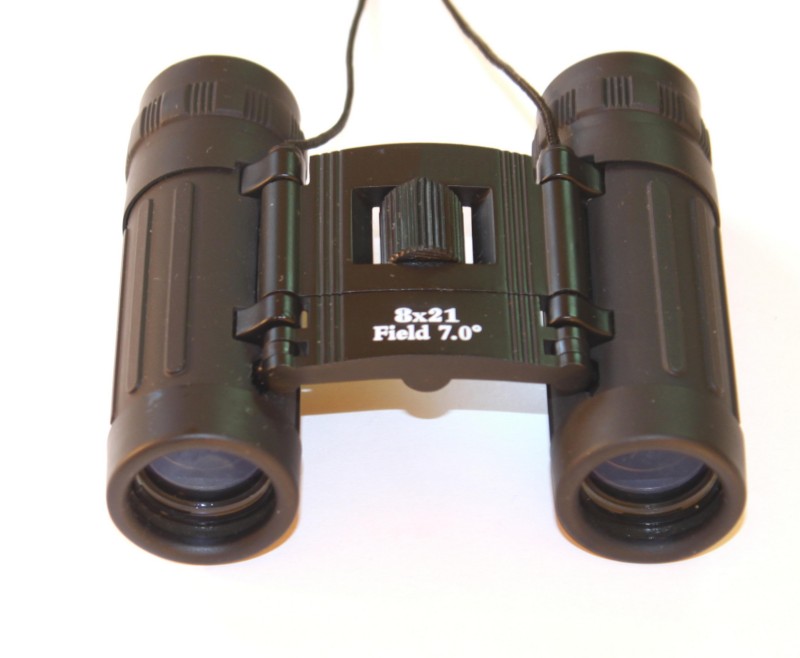
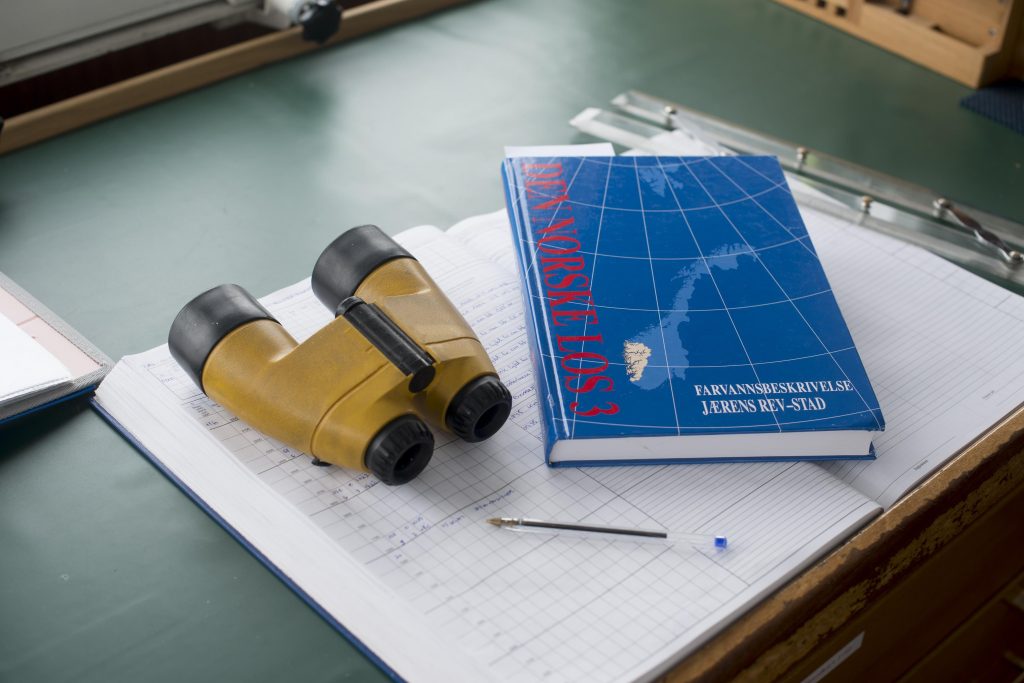
8×21 / 8×25: Typical Pitfalls in Travel and Concert Lines
- Size vs. eye box trade-off: The smaller the body, the harder it is to provide comfortable eye relief and a forgiving eye box. Users who wear glasses are more sensitive to this.
- “Impressive” nominal FOV but low usability: Edge aberrations and vignetting are more easily amplified. Usable field of view should be prioritized over the FOV number alone.
- Focus and shake sensitivity: Lightweight models rely more on focusing feel and structural clearance control; otherwise, users may perceive the image as “floating.”
8×32: The Easiest Platform to Build a “True 8×” Reputation
- It offers a better balance between weight, brightness, and usable field of view, making it one of the safest platforms in the $100–$300 range.
- It is well suited for a comprehensive upgrade focused on “usable edges + backlight contrast + glasses-friendly design.”
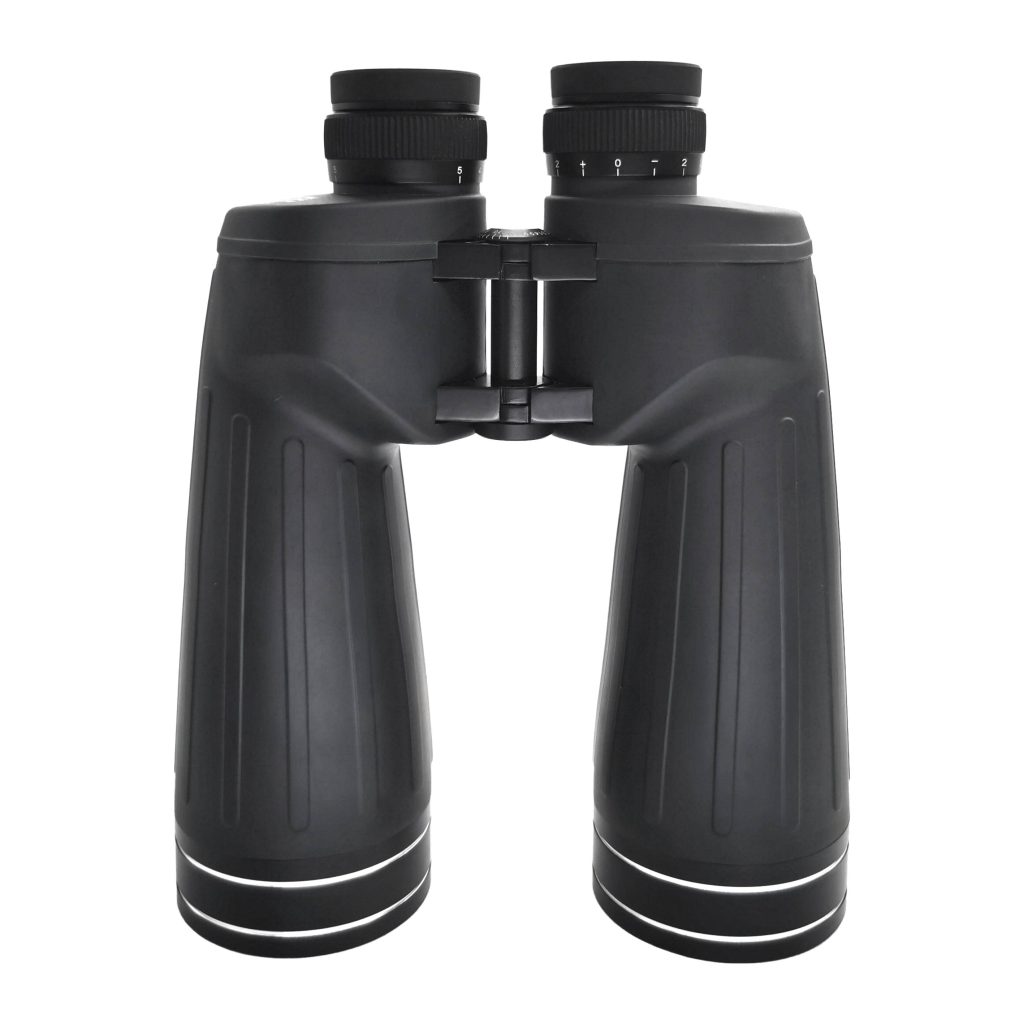
8×42: Advantages for Birding / Low Light and the Engineering Trade-Off
- The low-light advantage comes from exit pupil size and overall system efficiency, but the increased weight and size raise user expectations for handling and structural stability.
- Sealing, waterproofing, and nitrogen purging increase rework costs, so the assembly window and sealing solution should be reviewed together.
8) RFQ / Prototype Review Checklist: Writing “True 8×” into the Contract and Acceptance Criteria
The following questions can be directly used for quotation, prototype review, and factory audit (it is recommended to require data or reports from suppliers, rather than verbal promises):
- What are the magnification measurement conditions? (infinity/distance, temperature, focus position, eyepiece diopter). How is batch consistency verified?
- For the nominal TFOV, what is the “usable field of view”? Is the edge illumination curve provided?
- What are the acceptance targets and methods for edge image quality? Can the dominant factor (astigmatism / coma / field curvature) be distinguished?
- What is the evaluation method for backlight glare? Is there documentation of internal blackening processes and coating consistency data?
- How is image alignment error defined (horizontal / vertical / rotational)? What are the sampling ratio, rework rate, and rework strategy?
- How are positioning and repeat assembly accuracy ensured for key structural components (hinge axis, prism housing, lens mount)?
- If waterproofing / nitrogen purging is included, does rework require breaking the seal? How is the rework cost controlled?
- Is there a golden sample and batch comparison mechanism? During mass production, how is polarization in evaluation distribution (“two extremes”) controlled?
Conclusion: Turning “True 8×” from a Marketing Term into an Engineering Advantage
When magnification definition, aberration budget, and assembly yield are connected into a closed loop, “true 8×” is no longer something vague or mystical.
It becomes a repeatable engineering capability:
• Clear specifications: measurable and aligned across the supply chain;
• Controllable design: defined budgets with transparent trade-offs;
• Stable mass production: manageable windows and predictable yield.
This is exactly the core difference that determines reputation and repeat purchases in the $50–$300 mainstream market.